The post A March Madness Champion: Lucky or Good? first appeared on 'CATS STATS.
]]>Like I said earlier, games are regularly determined by slim margins that sometimes end up with unfavored teams winning and favored teams losing. Looking at Pomeroy’s luck statistic, we see that teams with a luck rating above zero are winning more games than expected, and are thus considered lucky, while teams with luck below zero are losing more than expected, and are thus unlucky.
This year, Pomeroy’s ten luckiest teams are
| UNC Greensboro, .167 |
| Georgia St , .143 |
| Kent St., .129 |
| Marshall, .125 |
| Abilene Christian, .123 |
| Canisius, .115 |
| FIU, .115 |
| UC Irvine, .110 |
| Nebraska Omaha, .109 |
| Princeton, .101 |
| Bold denotes NCAA bid, Italics denote NIT bid |
Three of these teams made the NCAA Tournament by winning their conference championship. And two also won the conference’s regular season title, while the other finished second. Seven of Georgia St.’s 13 wins in the Sun Belt came with a two-possession victory or smaller. That luck led them to the 1-seed in the tournament. The Anteaters of UC Irvine won three OT games before upsetting Kansas St. by two possessions.
Even though these teams were fortunate and can be said they were somewhat “good at winning close games”, there was no guarantee that they would continue to play at the level that represents their record.
Conversely, let’s take a look at the ten (plus one) unluckiest teams of 2019.
| Boise St., -.192 |
| Little Rock, -.149 |
| American, -.119 |
| Mercer, -.113 |
| Colorado St., -.111 |
| Northwestern, -.111 |
| Dartmouth, -.109 |
| Vanderbilt, -.109 |
| Western Illinois, -.106 |
| Akron, -.105 |
| Penn. St., -.102 |
As expected, there are no NCAA or NIT teams on this list. Northwestern (#73 in Kenpom overall) and Penn State (#40) certainly had the talent to gather more wins, but lost close game after close game in the Big Ten. Penn State lost nine key games this year decided by four points or less (or OT). While I am not convinced that a team has a statistical “clutch factor”, the chances of losing NINE games like that are not too favorable. Reverse a couple passes, shots, fouls, and rebounds and we could be looking at an NCAA bid here.
UC Irvine, Georgia St., and Abilene Christian were good but certainly lucky, and Penn State and Northwestern were great on paper but unlucky in their bottom line. A team with a decent record and good luck rating is a coach clinging to his job. A team with a great record and a good luck rating is a team you don’t want to face in a tournament. A team with a great record and a low luck rating is one you really won’t want to face, if their luck turns around.
Now, how about the luck ratings of teams who have made some noise in the dance? Let’s start with THE Cinderella. Who had the second-best luck rating of 2018? That’s right, it’s UMBC, the only 16 to ever beat a 1. Don’t say that didn’t have anything to do with the upset of Virginia. Who was number 22 that year? No, it’s not a trick question, it’s Loyola of Chicago. Middle Tennessee in 2016? Number 21. 2010’s #9 Northern Iowa over #1 Kansas? Number 85. These teams were average to good, but found the luck when it was needed the most, like UMBC cashing in from 3 against the Hoos.
When we take a look at the last ten national champions, we find that seven of them had positive luck ratings, meaning that the winners of the NCAA Tournament won more games than they should have based on their points scored and allowed, and were thus incredibly lucky. In a single elimination tournament like March Madness, luck plays a significant role in determining a matchup between close teams. The luckiest champion, as one would most likely guess, was the 2014 #7 seed Connecticut Huskies, the 23rd luckiest team that season with a rating of +.08. With two-possession or closer games over Saint Joseph’s, Iowa St., Michigan St., and Kentucky in the national championship, the Huskies pulled out a bunch of close games that could have gone either way. Other lucky champions include the Anthony Davis-led Kentucky team in 2012, the Duke 2015 champions with Jahlil Okafor, and of course the Kemba Walker UConn run in 2011. However, we can also identify the more “worthy” national champions who were unlucky throughout the season and still won the title. Louisville’s 2013 banner was vacated, but 2009 North Carolina and 2018 Villanova were two of the more dominant teams of recent memory, with each team winning every NCAA tourney game by double digits, which is incredibly impressive. These two teams certainly didn’t need luck to win it all!
Is winning these close games a skill? If it was, Coach K’s Duke squads should be ranked lucky year in and year out, but in reality, they have been not. Coach Krzyzewski was 135th this year and 271th a year ago. Calipari’s Kentucky squad was 98th this year but was just 199th last year. Even Bob McKillop’s “no one and done” team was 55th this year, 318th in last year’s NCAA appearance, and 259th two years ago. So, it seems the “luck” stat is just that, luck.
So, is it better to be lucky than good in the NCAA Tournament? In a single elimination “best-of-1” tourney, unless you can seriously separate yourself from the competition, better teams on paper will fall while other champions will rise.
This year, ALL FOUR of the final four teams have a positive luck rating. The final #1 seed remaining, Virginia, leads the group. A top-100 luck team has won the tournament five times last decade! The average luck rating of a winner the last ten years is .0273, close to where Auburn stands. This makes it clear that it doesn’t take just skill to win the NCAA Tournament. Virginia’s luck continues, and Duke’s just ran out.
The post A March Madness Champion: Lucky or Good? first appeared on 'CATS STATS.
]]>The post Cats Stats Visualizes the Sweet 16 first appeared on 'CATS STATS.
]]>
This visualization, inspired by a work by NBA analyst Kirk Goldsberry, depicts the Kenpom adjusted offensive and defensive ratings for each Madness team still standing. After looking at this graph, it is clear to see that the West region is stacked with top offensive and defensive teams, containing the number 1 offense (Gonzaga) and the number 1 defense (Texas Tech). Expect the Sweet 16 matchup between the Red Raiders and the Michigan Wolverines to be a dogfight, as the top 2 defenses in the country go head to head. The winner of that battle will likely face the number 1 offense in the Zags (pending a possible FSU upset), which if Texas Tech wins will feature the nation’s best offense against the best defense. Count me in for that one. Over at Louisville in the South region, we have the biggest mismatch of the Sweet 16, #1 Virginia vs. #12 Oregon. The highest rated Kenpom team will take on the worst rated team remaining, with Pomeroy giving an 82% chance that UVA advances. But can the Ducks pull off what would be the last chance for Cinderella this year? Oregon is rated 72nd on offense and 15th on defense. Loyola Chicago finished 63rd on offense and 17th defensively and made a historic run to the Final Four. Can the Ducks channel the magic of Sister Jean just one year later?
Looking at the graph, we can cluster the remaining teams into three tiers, on our knowledge that teams to the northeast of the chart are better than teams to the southwest.
Championship Contenders: (Texas Tech, Michigan. Virginia, Gonzaga, Duke, Kentucky, North Carolina, Michigan State)
Final Four Sleepers: (Florida State, Houston, Virginia Tech, Purdue, Tennessee)
Deep Sleepers: (Oregon, LSU, Auburn)
I expect a Tier 1 team to cut down the nets in Minneapolis, but in true March fashion, you never know. Purdue, Auburn, and Oregon are particularly playing stellar basketball right now, but you know those top teams who have worked hard all year round to secure a top seed will not go away easily. One thing’s for sure, it’s gonna be a heck of a weekend for college basketball.
Enjoy the Sweet Madness!
The post Cats Stats Visualizes the Sweet 16 first appeared on 'CATS STATS.
]]>The post JAG For A-10 POY: The Numbers Say There’s No Debate first appeared on 'CATS STATS.
]]>
The Atlantic 10 regular season has come to a close, with VCU securing the regular season championship. Now, before the fun gets going in Brooklyn, the biggest question remaining: Who will take home A10 Player of the Year honors? Several players have had noteworthy seasons, including Javon Bess (Saint Louis), Marcus Evans (VCU), Josh Cunningham (Dayton), Justin Kier (George Mason), and Sincere Carry (Duquesne). Each of them has their own legitimate cases for the conference’s top individual honor. No player, though, has meant more to his team and had a more universal impact than Davidson’s Jon Axel Gudmundsson, and a look at Game Score in the A10 all but guarantees his crowning as 2018-19 Player of the Year.
Created by John Hollinger, Game Score is a single number representing a player’s all-around performance in a single game, taking into account each stat in the box score. The stat is calculated as follows:
GS=PTS+ .4FGM – .7FGA – .4(FTA-FTM) + .7OREB + .3DREB + STL + .7AST + .7BLK – .4PF – TO
Note that this metric gives the most weight to points, steals, and turnovers, which are arguably the most productive offensive and defensive stats.
What is a good Game Score, then? The NCAA D-1 average is about 4.2, and the A-10 average comes out around 4. A Game Score of 4, though, indicates a fairly mediocre performance. A good performance would be a score of at least 10, which is in the 90th percentile of all NCAA players, and a great performance would be a score of at least 16, which is in the 99th percentile. The best players put up even better numbers. Duke’s Zion Williamson averages an astounding 21.45 Game Score per game, and the highest average Game Score (as of March 3) belongs to NCAA bound Murray State’s Ja Morant, whose average is a 22.01 Game Score per game.
Aside from being an easy way to judge a player’s overall single-game performance, Game Score can have several practical uses. For example, when plotted against average minutes played per game, one can analyze if a player’s ability justifies his playing time. Players farther above the trendline can be considered underutilized and worthy of more playing time (with the exception of Ja Morant, who already plays over 36 minutes per game), as they produce at an above-average level in less time than other players. On the other hand, players well below the trendline, especially those to the right of the NCAA average for minutes played, can be considered overutilized.
Mouse over a team’s logo to find Game Score versus minutes played for a particular player on the team. The best players are found on the top right of the chart, and the not so good on the bottom left. Players with high y-values are outperforming their minutes, and those with low y-values are underperforming.
We can then take this information and assign an efficiency score to players by dividing their average Game Score per game by the average number of minutes played. Among players from over 14 different conferences who play at least 5 minutes per game, NC State’s Ian Steere claims the title as college basketball’s most efficient player with a 1.06 efficiency score. He’s followed by Duke’s Zion Williamson, who has a .761 score, and ETSU’s Octavion Corley, who has a .741 score. Ja Morant ranks 6th with a .606 score.
As of March 6, here is JAG’s dominant perch atop the rest of the A10.
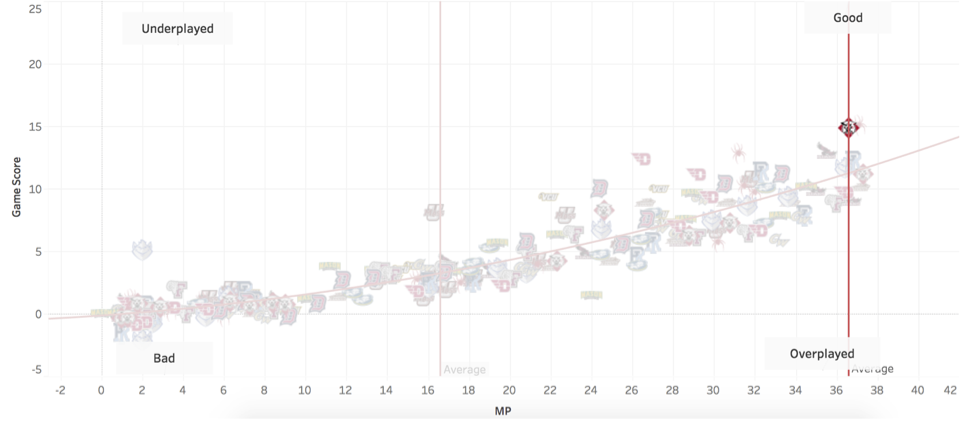
Gudmundsson has recorded a Game Score of at least 20 in nine games this year. NINE. Keep in mind, a score of 20 is indicative of an elite performance, so Jon Axel has put up an elite number in over a quarter of the games he’s played this year. Marcus Evans, Josh Cunningham, Justin Kier, and Sincere Carry COMBINE for TEN games with a Game Score of at least 20. Scoring points and contributing significantly on offense gets you noticed, certainly, as players like Charlie Brown and Obi Toppin can confirm, but when it comes down to being the best player on the floor, one must be present on both sides of the court. The truth is that no one in the Player of the Year conversation even comes close to matching Gudmundsson’s consistent dominance. Another point for JAG.
Game Score paints a clear picture that Jon Axel Gudmundsson is the most complete player in the A10 this year. Looking at the individual numbers, it gets even more clear. He plays an excellent, diverse game on offense, both scoring himself and creating chances for others. He’s 3rd in the conference in points per game (17.2) and 4th in total assists (146). His constant production puts him number one in the league in points produced per game. His presence on offense puts him to the free throw line on a consistent basis, as JAG leads the A10 in free throws made (145), and has the 4th best free throw percentage (82.4%). On defense, he’s just as strong: he leads the A10 in defensive rebounds with 204 (he’s 5th in total rebounds) and is 4th in defensive win shares among all A10 players. JAG is 1st in overall win shares by FAR (he has 6.1, the next closest is SLU’s Javon Bess with 4.9). No player in the conference can claim a top-5 standing in points per game, assists, free throws made, and total rebounds except Jon Axel Gudmundsson. He truly does it all. Game, set, match.
JAG is the best player in the Atlantic 10 this year hands down. There is no comparison to his level of offensive and defensive presence, and both the eye test and the numbers test can prove it. He contributes to every aspect of every game, and his Game Score shows it. At what point should JAG be talked about on a national scale? His nine 20+ Game Score performances have something to say about that. The first step, though, is being awarded A10 Player of the Year, which should almost certainly be a lock for our Icelandic star.
Want to explore our graph for other players? Try the Tableau graph below.

The post JAG For A-10 POY: The Numbers Say There’s No Debate first appeared on 'CATS STATS.
]]>The post Rudy was Snubbed! first appeared on 'CATS STATS.
]]>
Every year, hundreds of basketball commentators, writers, and fans discuss the deserving NBA players left out of All-Star honors. Unfortunately, the All-Star vote (with 50% of the vote coming from fans) routinely appears to be more of a popularity contest and a selection of stars from big-market teams. This year provides a perfect case. Klay Thompson of the world champion Golden State Warriors and popular star Russell Westbrook were both selected over another player who was more deserving.
There are many ways to evaluate the performance of an NBA player, but the tried and true method has been Dean Oliver’s offensive and defensive ratings. This is the number of points produced and points allowed per 100 possessions respectively, while the player is on the court. USG% is another key factor which shows us the level of player involvement on the floor. It is the rate that a player finishes an offensive play while he is in action. Thus, it is harder for a player with higher usage to achieve high efficiency. Therefore, we should reward players who are the most efficient while still carrying a high usage rate. Usage Value Wins (inspired by Oliver’s concept) can be defined as
UVA = (ORtg12.5*82*USG)/[100*(ORtg12.5 + DRtg12.5)]
Here are the UVW ranks of the 2019 Western Conference All-Stars who will take to the court in “our backyard”: Charlotte, NC.
| Player | UVW | NBA Rank |
| James Harden | 23.28 | 2 |
| Anthony Davis | 21.72 | 3 |
| Paul George | 20.31 | 5 |
| Stephen Curry | 20.13 | 7 |
| Nikola Jokic | 19.28 | 9 |
| LeBron James | 18.74 | 10 |
| Kevin Durant | 18.69 | 11 |
| Damian Lillard | 17.92 | 12 |
| Karl Anthony-Towns | 17.40 | 14 |
| LaMarcus Aldridge | 15.36 | 18 |
| Russell Westbrook | 13.40 | 30 |
| Klay Thompson | 8.89 | 89 |
Klay Thompson’s contribution does not warrant All-Star consideration, judging by his -3 difference between his offensive and defensive rating, even on a top-level team. Russell Westbrook only had a +2 difference but with a USG% of over 30. And then there is one player with a massive +32 difference, even with a modest 17.4 USG%. His TS% is outstanding at 67.5, and he leads his team with a 22.2 total rebound %. Let’s see this player in the rankings.
| Player | UVW | NBA Rank |
| James Harden | 23.28 | 2 |
| Anthony Davis | 21.72 | 3 |
| Paul George | 20.31 | 5 |
| Stephen Curry | 20.13 | 7 |
| Nikola Jokic | 19.28 | 9 |
| LeBron James | 18.74 | 10 |
| Kevin Durant | 18.69 | 11 |
| Damian Lillard | 17.92 | 12 |
| Karl Anthony-Towns | 17.40 | 14 |
| LaMarcus Aldridge | 15.36 | 18 |
| Mystery Player | 13.84 | 25 |
| Russell Westbrook | 13.40 | 30 |
| Klay Thompson | 8.89 | 89 |
As you can see, he creams Klay Thompson and narrowly beats out Russell Westbrook. Who is this mystery player? His name is Rudy Gobert of the Utah Jazz. The team is just the 7th seed in the West and the 4th smallest NBA market in the league. Gobert is extraordinarily deserving of an All-Star spot but still did not get the nod. And the fans were not the only ones upset: Gobert was emotional in a recent press conference after he learned he didn’t make the cut. Players have pride in making the All-Star teams. Denying a player who obviously put in the effort to be there is truly disappointing. We all know that the NBA is an analytics-driven league. Should we give more votes to the analytics honchos in the future? Unfortunately, the NBA is most importantly a star-driven league, and the stars will nearly always have first priority in this premier showcase of basketball talent.
The post Rudy was Snubbed! first appeared on 'CATS STATS.
]]>The post For Quarterbacks, is Age only a Number? first appeared on 'CATS STATS.
]]>
The first two columns of the chart do not seem too surprising, but when QBs have been 7-9 years apart, the less experienced players have actually outscored the veterans. In 2016, our team right down the road, the Carolina Panthers, annihilated Carson Palmer’s Arizona Cardinals 49-15, thanks to the outstanding play of MVP Cam Newton, which was likely the last hope for 36-year-old Palmer’s chances at a ring. But the biggest surprise of them all was young Joe Flacco’s stunning victory (just before his 25th birthday) over Tom Brady back in 2010 by a solid 19 points, taking advantage of three early Brady turnovers.

However, when the QB experience reached double digits, the veterans began to take over. The most overwhelming performances include Brady’s bashings of Marcus Mariota in 2018(35-14) and Andrew Luck in the 2014-15 AFC title game by a sound 45-7 (with a possible asterisk due to supposed deflated footballs), along with 40-year-old Brett Favre’s 34-3 win over a young Tony Romo in 2010. So, do Mahomes and Goff have a chance on Sunday? Even with this veteran dominance, one QB has been extraordinary against his older peers. Russell Wilson(in just his second season), albeit aided by his elite Legion of Boom defense, stifled Peyton and the Broncos 43-8 in Super Bowl XLVIII. With the new kids on the block looking legit, despite the data it wouldn’t be surprising to see a complete changing of the NFL guard. But Tom Brady and Drew Brees, the keepers of the castle, will for sure have something to say about that.
The post For Quarterbacks, is Age only a Number? first appeared on 'CATS STATS.
]]>The post Running Away with The Record Books: Davidson Football first appeared on 'CATS STATS.
]]>
Under the leadership of first-year head coach Scott Abell, the Davidson Wildcats football team has put together an incredible turnaround after a rather disappointing 2017 campaign.
Here’s a look in the remarkable change of the ‘Cats key offensive statistics over the past four years. The stats are mind-blowing.


It’s safe to say that Davidson Football has turned the corner. To see how far around that corner, here’s one more set of stats.
| Davidson Offensive Statistic | % Change from 2015 to 2018 |
|---|---|
| Rushing Yards Per Game | 514.8% |
| Points Per Game | 362.4% |
| Yards Per Play | 202.6% |
The headline of this year’s story is the unrelenting rushing attack of Coach Abell’s new offensive system. The triple-option-based system has them ranked first in FCS in rushing offense, totaling 4,350 yards on the ground, almost 600 yards more than any other FCS team, and averaging 435 yards per game.
The ‘Cats have surged to first in total offense with 562.7 yards per contest and third in third-down conversion % (53.2).
They boast the best points per game in the Pioneer League with an impressive 45.3 PPG, assisted by their 91-point explosion against the Guilford Quakers. The mind-boggling win set records across the board, including 13 Wildcat touchdowns.
The offense has been explosive this year, scoring 8 TDs on runs of over 60 yards and averaging a Pioneer League-leading 7.7 yards per play. The team has scored 14 total touchdowns of 50+ yards, accounting for 21.8% of all of Davidson’s TDs.
On Saturday in Davidson’s 56-52 loss to San Diego, the ‘Cats broke the long-standing Division I record for most rushing yards in a game, racking up an astounding 789 yards on the ground. For only the second time in FCS history, four separate players ran for 150+ yards.
The team also boasts three players among the top ten rushing leaders in the Pioneer league: RB Wesley Dugger, WR William Wicks and QB Tyler Phelps. Sophomore standout Dugger leads the Cats running game, ranking 2nd in the Pioneer League in yards and 8th in FCS overall.
As the Wildcats head into their season finale at Richardson Stadium for a Senior Day matchup against Butler, they look to finish their season on a high note while riding an impressive first season with the new coaching staff.
Things are looking up for years to come should the Cats keep rolling with their new hard-nosed rushing attack which has already paid large dividends to the program’s success.
The post Running Away with The Record Books: Davidson Football first appeared on 'CATS STATS.
]]>The post 2018-19 Men’s Basketball Preview first appeared on 'CATS STATS.
]]>
The Atlantic 10 Men’s Basketball Champions are back! Coming off a thrilling run through the 2018 A-10 Championship where they claimed their first conference tournament title, the ‘Cats are primed for another trip to madness. Let’s go inside the numbers of your 2018-19 Davidson Wildcats.
Kellan Grady
Sophomore
Guard
After four spectacular seasons, Peyton Aldridge’s time at Davidson is up, meaning that much of the spotlight this season will be on Grady. In an outstanding freshman season, Grady led Davidson’s starters in Offensive Rating (122.4), meaning Grady produced 1.224 points per all of his possessions for the Wildcats. Most impressive, Grady had the 13th lowest turnover rate in the nation at 7.4%. He turned the ball over more than twice in only two games and he dished out twice as many assists as turnovers. During the A-10 Tournament, Grady shot 43.8% from deep and turned the ball over just twice. Named by several pundits as one of the top players in the country, Grady will look to build on his electrifying stats as he leads the Wildcats into their defense of the A-10 title.
Jon Axel Gudmundsson
Junior
Guard
Grady and Gudmundsson give the ‘Cats one of the finest backcourts in the country. The junior from Iceland has been immensely valuable for the Wildcats. “JAG” is effective on both sides of the ball. An offensive Swiss Army knife, Jon Axel became just the fifth Division I player in the past 25 years to average 13 points, 6 rebounds, and 5 assists, all while shooting 40% beyond the arc during the regular season. His assist percentage of 25.6% led the team last season. He thrived in high pressure situations, making a game-winning layup to knock off #17 Rhode Island at Belk Arena and connecting for six three pointers in the NCAA Tournament game against Kentucky. But by far the most underrated aspect of Jon Axel’s game is his defense. His 1.8 defensive win shares topped the Wildcat squad, and he was the only ‘Cat last year in all of the top six lineups in defensive efficiency with 10 or more possessions.
KiShawn Pritchett
Junior (RS)
Guard
A native of Mooresville, Pritchett has been one of the most efficient Davidson players. Pritchett posted an excellent 60.5% effective field goal percentage in ‘17-’18, and improved his 3 point shooting percentage from 28.8% his freshman year all the way to 43.8% this past season. His offensive turnaround on a whole was impressive, going from a 87.2 offensive rating freshman year to a 112.2 last year. He finished the year strong, shooting 50% from three point range combined in the Atlantic 10 championship game and the NCAA Tournament.
Luke Frampton
Freshman (RS)
Guard
This freshman has been heralded as a deadly shooter. He excelled in our exhibition against Washington & Lee, catching fire in the second half and making 5 of 8 threes in the game, along with collecting 2 steals. Look for him to fire away all season long, and don’t be surprised if he becomes a force in the A-10 by season’s end.
Luka Brajovic
Freshman
Forward
The Austrian had an outstanding debut, shooting 70% from the field and grabbing a team-high 8 rebounds. This international talent at 6’ 10” looks to be an effective post player for the Wildcats in the coming years.
David Czerapowicz
Freshman
Guard
Another new face excelled in that game. Brother of former Wildcat Chris ‘14 shot an awesome 4 of 5 from three point range against the Generals and contributed 4 assists. Playing for 25 minutes in the win, we expect Czerapowicz to have a significant role for the ‘Cats.
Nathan Ekwu
Senior (RS)
Forward
You may have heard the thunderous applause when Nathan walked back onto the court on Thursday. The redshirt senior, returning from injury, had not played since the 2016-17 season. A key contributor on defense, Ekwu has posted defensive ratings under 100 (lower is better) for two out of three seasons. He was especially effective in 2015-16, achieving the team’s best defensive rating and second-best offensive rating while shooting an even 50% from the field playing 20 minutes a game. Wildcats fans will be able to enjoy one more season of Ekwu’s great play in ‘18-19.
The ‘Cats are loaded with talent to make another postseason run, and after a long few months of preview and analysis, it’s time once again to dance to “Sandstorm,” sing “Sweet Caroline,” and cheer on your beloved Davidson Wildcats at Belk Arena!
The post 2018-19 Men’s Basketball Preview first appeared on 'CATS STATS.
]]>The post Basketball’s Perfect 10 first appeared on 'CATS STATS.
]]>
What is a perfect game in basketball? We all know about the perfecto in baseball and perfect 10 in gymnastics. Even the NFL’s passer rating metric has a maximum value. But is there a way to quantify that a player had a flawless game in hoops? Do they need to make every shot? A pitcher does not need to throw entirely strikes to pitch a perfect game, neither does a quarterback need to complete every pass to obtain a perfect passer rating. But, they need to avoid major mistakes, such as base hits, interceptions, or, in basketball’s case, turnovers. So, I tried to find a method to rate a basketball player’s single game contribution to a team out of a possible 10 points. The famous statistician Dean Oliver came to my aid in this project stating the importance of several factors in the game of basketball.
Shooting – 40%
Turnovers – 25%
Rebounding -20%
Free Throws – 15%
The first metric is shooting, which is by far the most weighted of the Four Factors. Does this make sense? Certainly. Shooting determines the end result of most possessions and is the only measure (along with free throws) that points are added to a team’s and player’s totals. A player’s shooting performance can ultimately make or break a team’s performance, and we saw it in Davidson’s win over St. Bonaventure in the Atlantic 10 Tournament, and unfortunately also in their loss in the NCAA Tournament to Kentucky (albeit the 6 for 11 night by Jon Axel Gudmundsson).
An ideal way to measure shooting performance is to weight three point field goals higher than two point shots, and that is done by the metric of effective field goal percentage, which weights three pointers 1.5 times more than twos. A 100 percent performance is not needed; any effective field goal percentage of over 70 is an outstanding day; it is rare to do better. Hitting every field goal in a game is next to impossible, so a perfect score would be nearly unattainable If the bar is set higher.
Maybe the most important metric stressed by a coach is that of avoiding turnovers. Giveaways not only lose a team possessions, but also allow a much easier opportunity for the opponent to score on the fast break. Turnovers can also have negative effects in loss of confidence and momentum, and can lead to large scoring runs by the opposition. For a player to have a perfect game, it is essential to play turnover-free basketball for the entirety of the contest, because they are almost always caused by poor decision making and/or lack of execution. However, a player can also force opponent turnovers through steals, which is why turnover percentage minus steal percentage is the best way to find out the rate of a player taking away opponent’s possessions to a player losing his own possessions. To calculate this part of the metric, we use turnover percentage and steal percentage, which is the estimate of a player’s giveaway and steal rate per 100 possessions, respectively. Thus, it is possible for a player to still obtain a perfect rating with a turnover or two if it is highly offset by multiple takeaways.
Rebounding is the next most important factor. Collecting boards allows for extra shots and decreases the opponent’s chances at extra shots. For this experiment, we are looking at total rebound percentage (percentage of all offensive and defensive rebounds that are grabbed per 100 possessions), Why not just offensive rebounds? Yes, getting the board on the offensive end gives your team an extra opportunity to score. But missing a defensive rebound can give an offensive board to the opposition, while collecting it saves from an opponent’s extra opportunity. In baseball, a strikeout and a flyout to the warning track both count towards a perfect game. Many analysts apply Four Factors to both offense and defense, and improving your “defensive” offensive rebounding percentage means simply to grab more defensive rebounds. Perhaps if we were evaluating a player’s rebounding skill alone we would make offensive boards more valuable due to them being more challenging to obtain (again, like strikeout percentage in baseball). Additionally, not all total rebounding percentages are created equal. Centers and forwards tend to collect more due to their height and play style, so the metric is adjusted for each position, in such a way that centers need to collect a higher percentage of rebounds than guards to get full marks.
Finally, if I said earlier that coaches will harp on turnovers the most, maybe I was wrong. Free throws are such an important aspect of basketball, and decide the outcome of seemingly every close game. Free throws are “free” meaning there is no defensive pressure, thus players should be able to sink every free throw opportunity they are given to keep a perfect rating. Missing a tough shot guarded by a defender is excusable, but missing a straight shot at the basket without any hands near your face should be considered a mistake. Free throws are meant to be made, not missed. Thus, a player who misses a free throw should not be deserving of playing a perfect game. If the player attempts no free throws during a game, I give 75 percent credit, but I do not give 100, due to the player’s lack of effort to get to the free throw line, which denies the team chances for easy points.
Using these four different calculations, I weighted them accordingly to produce a rating out of 10 (similar to player ratings in professional soccer) to reflect a player’s overall contribution to the team in a particular game. Here are the ratings for each starter from the four games of this year’s NBA Finals:
Player |
Game 1 |
Game 2 |
Game 3 |
Game 4 |
|---|---|---|---|---|
LeBron James |
8.235 |
7.648 |
7.707 |
6.796 |
Kevin Love |
8.133 |
8.019 |
8.802 |
7.115 |
JR Smith |
7.482 |
4.566 |
7.784 |
7.365 |
George Hill |
6.939 |
7.637 |
4.927 |
4.172 |
Tristan Thompson |
5.265 |
7.865 |
7.100 |
8.190 |
Kevin Durant |
7.444 |
9.014 |
9.545 |
7.969 |
Stephen Curry |
8.667 |
8.696 |
6.406 |
9.014 |
Draymond Green |
9.035 |
7.682 |
6.445 |
6.921 |
Klay Thompson |
8.306 |
7.440 |
7.449 |
7.642 |
Kevon Looney |
8.426 |
|
|
|
JaVale McGee |
|
7.800 |
7.994 |
8.460 |
We can see here some interesting trends about what happened in the Finals. For the Cavaliers, Kevin Love’s impact was shown when looking at his great shooting efficiency and high rebounding totals, even when adjusted for the center position, and was consistent in bringing returns all series long when other players struggled, except for when they basically gave in during Game 4. Although not talked about much, George Hill’s and JR Smith’s poor shooting significantly hurt the team in Games 2,3, and 4. LeBron’s turnover rates were not spectacular enough to earn him high overall ratings, and his shooting was great but not amazing, aside from Game 1. On the Warriors side, Kevin Durant’s numbers supported the decision to give him the Finals MVP award, averaging an 8.49 rating over the series compared to Curry’s 8.2. His performance during Game 3 was nearly flawless except for three turnovers committed. It seemed that if either Curry or Durant was having a less than ideal game, the other made up for it. Finally, the performance of both Kevon Looney and JaVale McGee was underappreciated but extremely helpful in taking high-percentage shots and limiting turnovers, which are huge in winning basketball games.
So, have we seen any perfection lately? It is hard to come by. Davidson’s own Stephen Curry has received two flawless 10.0 ratings: one on January 18, 2016 against LeBron’s then Cleveland Cavaliers making 7 of 12 from three point range for 35 points in a 34 point win. Steph did have one turnover, but it was offset by three steals on defense to overcome the giveaway. The other perfect outing was last December 30 in a 141-128 triumph over the Memphis Grizzlies. Steph made an insane 10 of 13 from 3 and did not give the ball away all night, while making all his free throws. All this on his first game back from an ankle injury, which shows how impressive this Davidson product continues to be. Is more perfection in the future for 30-year-old Steph Curry? Why not? This rating system can help identify players that have recently contributed to their team through the most important ways in games and showcase the players who are helping their teams succeed the most.
Image by © Ellen H. Wallop/CORBIS
The post Basketball’s Perfect 10 first appeared on 'CATS STATS.
]]>The post So You’re Saying There’s a Chance? Poisson World Cup Predictions first appeared on 'CATS STATS.
]]>
The game of soccer is an interesting one. A team can outshoot the other and have far better chances, but end up losing. Likewise, a team playing poorly can have one big chance in the whole match and use it to score the game’s only goal. As we have seen so far in the 2018 FIFA World Cup, there have been many outcomes and statistics that we have not expected. How can we find a way to model the tournament to find teams with the best chances of winning? There are a couple measures that can give us a good sense of how likely team A should defeat team B based on data collected by previous international games. One such method can find the expected number of goals a team should score against a certain opponent. Based on the expected value, we can use Poisson distributions to find the probabilities of a team scoring a specific number of goals and use that to find win, loss, and draw percentages.
International teams are relatively tricky to evaluate because they play few games throughout a long cycle of 4 years between World Cups. Unlike a regular yearly season, there is much more turnover between players and team personnel. Thus, the sample size of predictive games is smaller than desired. In order to create probabilities for the third round of group stage matches, I took into account the country’s previous ten games against top 80 national teams, including the first two World Cup matches. Using simply goals scored per game is not enough, because the strength of a team’s defense can influence how many goals are conceded. So, we want to normalize the amount of goals scored and goals allowed per game by each team by comparing how it stands against the average for all 32 World Cup teams. In their last 10 games before the final group stage game, World Cup teams scored 1.425 goals per game and allowed 1.1375 per game. The ratio of a team’s goals scored and allowed to the average produces Offensive and Defensive Strength values. An offensive number over 1 signifies an above-average World Cup offensive team and a defensive number under 1 is given to an above-average defensive team. For example, Spain’s 2.5 goals per game translates to a 1.75 offensive strength number and .9 goals allowed per game results in a .8 defensive strength number. This is how we can determine how a defense can affect an offense’s scoring results. To find the amount of expected goals of an offense against a defense, we multiply the offense’s value by the defense’s value times the average goals per game of the last ten games played by each World Cup side (1.281) , which is the expected goals scored in 90 minutes between a team’s offense and its opponent’s defense. We do the same thing for the opponent’s offense and the first team’s defense to find the opponent’s expected goals.
Now that we have the expected goal values, we can use the Poisson model to determine the probabilities of scoring a certain number of goals. Given an average number of occurrences, we can find how likely any integer of occurrences is to happen using the binomial distribution of outcomes. The probability P of n goals scored given an average of x expected goals per game (with accounting for opponent’s defense) can be determined by the equation
P = (xne-x)/n!
This table below shows probabilities that a team scores a certain number of goals in a hypothetical match between the nations. Each combination is found by multiplying the probabilities of the specific outcomes. It is found that scoring more than five goals has an extremely negligible probability.
| Russia 0 | Russia 1 | Russia 2 | Russia 3 | Russia 4 | Russia 5 | |
|---|---|---|---|---|---|---|
| Uruguay 0 | 0.067 | 0.054 | 0.022 | 0.006 | 0.001 | 0.0002 |
| Uruguay 1 | 0.127 | 0.103 | 0.042 | 0.011 | 0.002 | 0.0003 |
| Uruguay 2 | 0.12 | 0.097 | 0.039 | 0.011 | 0.002 | 0.0003 |
| Uruguay 3 | 0.076 | 0.062 | 0.025 | 0.007 | 0.001 | 0.0002 |
| Uruguay 4 | 0.036 | 0.029 | 0.012 | 0.003 | 0.0007 | 0.00008 |
| Uruguay 5 | 0.014 | 0.011 | 0.005 | 0.001 | 0.0003 | 0.00003 |
From here we can find match predictions , such as the expected score, which is the highest probability in the grid, the percentage of a draw( the sum of all the probabilities on the diagonal), the percentage of a Russia win, (the sum of all probabilities northeast of the diagonal, and the percentage of a Uruguay win, (the sum of all probabilities southwest of the diagonal) These outcomes can help one determine a strategy for wagering and analyzing matches and teams.
However, there are a couple limitations of the Poisson distribution predictions for soccer matches. For one, these outcomes cannot take injury, yellow/red cards, or tournament scenarios into account. In the last round of the group stage matches, many teams will not use their normal play style and play for a draw in order to qualify or rest/go easy on their star players if the squad has already qualified for the next phase of the tournament. In that regard, the probabilities may be skewed. One very important limitation is that of defense. A very “strong” defense under .5 could destroy a team’s expected goals value, which is unrealistic especially when using a smaller sample size. An offense scoring 2 expected goals a game matched with a defense allowing .2 expected goals per game should have a larger expected goals value than just .4. In other words, a great offense should not be severely penalized by a great defense, which gives unrealistically low expected goal values and could predict an amazing defensive team to go all the way regardless of their offense. So, I capped the defensive ratings to go no lower than .5.
For the third round of group play, the highest win/loss/draw probability matched the result 7 times, and the lowest probability matched the result only twice, one of them due to playing for a draw and the other an improbable upset of South Korea over Germany which shocked the entire globe. Using the model for the now-complete knockout stage, it favors Brazil to score a narrow victory in extra time over England in the final. If that’s the prediction, we’re in for a thrilling last two weeks at the World Cup.
The post So You’re Saying There’s a Chance? Poisson World Cup Predictions first appeared on 'CATS STATS.
]]>The post Injury Impact in the NBA first appeared on 'CATS STATS.
]]>
Led by Davidson’s own Stephen Curry and Finals MVP Kevin Durant, the dynastic Golden State Warriors completed the first NBA Finals sweep since 2007 over LeBron’s Cleveland Cavaliers. The decisive victory showcased both the star power and depth of this juggernaut team over a James- led Cavs squad with minimal other effective role players. The arsenal of weapons the Dubs had at their disposal this series was tremendous, which begs to question how dominant they could still be if key players were injured. How would the probability of one team winning the series change, say, if Curry was unavailable? We need a way to judge how much of an impact each player makes to his team through both offense and defense. We have that in win shares, which takes player contribution into account. The total amount of regular season wins that one team has is divided into win shares for each player on the team. On offense, the calculation takes points produced largely into its measure. The statistic represents the amount of points that a player makes possible during a game through made field goals and free throws, assists, and offensive rebounds leading to scores. We normalize this value with the league’s average PPP and the number of the player’s offensive possessions played in. We then take the team’s pace into account using marginal points per win by multiplying a constant of 0.32 by the league’s average PPG by the ratio of the specific team’s pace to the league’s average pace. Offensive win shares are calculated by dividing a player’s marginal offense by its team’s marginal points per win.
Similarly, defensive win shares are found by dividing a player’s marginal defense by the aforementioned marginal points per win. Marginal defense takes into account the number of points allowed by the player per 100 possessions, as well as a player’s minutes, team defensive possessions, and the league PPP. The sum of a player’s offensive and defensive win shares is their total number of win shares. For example, Steph Curry’s win shares for 2017-18 is 9.1 and Lebron James’ is 14. Note that the sum of each players’ wins shares on a team is the number of wins obtained through win shares, which should be very close to the amount of wins in the regular season. Normally, the more minutes a very efficient player has, the more win shares obtained because more minutes mean more opportunities to assist and score, as well as a higher ratio of minutes played to team collective minutes. Thus, an injury to a player like Curry that would cause him to miss time during the regular season will bring down his total win shares from what they should be. To adjust this, adding minutes to Curry’s total to what it would be if he never got hurt and subtracting minutes from lower guards in the depth chart would be an acceptable estimate to show how good the Warriors are when they are at full strength. That way, we can use these win totals to find the probability of beating teams in the playoffs with all players healthy. With Curry’s limited time in the season, GSW’s win shares total was 57.21. But with the adjustment to an always-healthy Curry, the total would jump to 61.25. But what if Curry was completely sidelined for (*gasp*) the NBA Finals? Then Stephen’s minutes would drop to zero and his time would need to be allocated by guards lower on the depth chart, most likely. Quinn Cook and Shaun Livingston would be the best candidates for seeing more time without Curry. Those players are not as efficient, with win shares/48MIN much lower than Steph’s. Since win shares are based on player involvement in minutes and not just performance, win shares/48MIN is a great metric to showcase how players are performing given their limited window of minutes. Curry’s is .267, the second largest in the league behind likely NBA MVP James Harden. So, as you may have figured out, the win share total of GSW would drop without Curry, and it turns out that it drops by a significant total. Without Curry, the Warriors would only have 51.15 wins, which is a 10-win dropoff from full-time healthy Curry, which is ENORMOUS in the NBA. But hey, 51.15 wins is still more the Cavs would have WITH Lebron (46.71). Even if Durant is lost too, the Warriors were still projected to win 48.7 games. Why? The answer is the depth that Golden State has with its forwards. Players like David West, Kevon Looney, Jordan Bell, and JaVale McGee all have above average win shares/48MIN , meaning that each player on the team is making efficient contributions to the club as a whole. The Cavs have only six active players that have a win share/48MIN rating of over .1, while the Warriors have nine of them. Golden State has more efficient pieces that can run the offense well and play defense compared to a bunch of below average bench players plus a couple starters and LeBron. It is worth noting that if LeBron also got injured, it would bring the Cavs from a 46.71 win team to a 39.51 win team, which more often than not does not make the playoffs. So losing LeBron would have sunk the Cavs from a mid-playoff seeded team to most likely a non-playoff team. And it didn’t hurt that much compared to Curry because James is ninth in WS/48 compared to Curry’s second place spot.
Even if Lebron stayed healthy and Curry plus KD got freak injuries, all hope may not have been lost for GSW, but it would have been a much closer series and would likely go 6 or 7 games. Just for fun, I used the same technique to find how much that Chris Paul injury hurt the Houston Rockets late in the Western Conference Finals. Paul’s WS/48 is .265, just 2 thousandths behind Steph Curry for third in the NBA. At full strength, Paul brings the 2017-18 Rockets 65.72 wins, and without CP3 that number drops to 57.47. This is on par with the Warriors with limited Curry and less than the Warriors with full-strength Curry. Needless to say, Paul’s injury ended up having a devastating effect on Houston’s chances of eliminating the Warriors, as they went from being favored to being the underdog versus GSW.
To calculate win probabilities, I used a formula developed by the Society for American Baseball Research, which takes into account the winning percentages for both teams and finds the probability that team A defeats team B. The calculation is defined here.
P(A,B) = (WPA (1 – WPB))/(WPA (1 – WPB) + WPB (1 – WPA))
where WP represents “win percentage” of team A or B. The probability found is the chance that team A defeats team B.
I made several scenarios regarding injuries to specific players, and found these different probabilities relating Houston, Golden State, and Cleveland.
| Scenario | Probability |
|---|---|
| Warriors defeat the Cavs with Curry, Durant, and LeBron | .6935 |
| Warriors defeat the Cavs without Curry, with Durant and LeBron | .5559 |
| Warriors defeat the Cavs without Curry and Durant but with LeBron | .5246 |
| Warriors defeat the Cavs with Curry and Durant but without LeBron | .7633 |
| full-strength Warriors defeat the Rockets with Chris Paul | .4270 |
| full-strength Warriors defeat the Rockets without Chris Paul | .5613 |
Is it surprising seeing the Warriors being favored without their two best players against the Cavs? I do not. The Warriors are a well-oiled machine that can still run without their most efficient parts due to their high efficiency win share numbers with bench players that can come in and play great team basketball to still give the Dubs a chance. We saw that in this year’s finals as the many role players such as West, Bell, and McGee gave Golden State quality efficiency in limited minutes, while the Cavs supporting cast failed to consistently produce, especially on defense. And yes, this is further proof that Chris Paul’s injury could have very well derailed the Rockets from vanquishing the juggernaut Golden State Warriors. Overall, injuries can definitely affect a team’s chances of winning it all, but basketball is a collective team game, and a great supporting cast can minimize what would be lost by losing a star player.
The post Injury Impact in the NBA first appeared on 'CATS STATS.
]]>