The post Diamonds Dancing: Predicting the Madness first appeared on 'CATS STATS.
]]>
Before the NCAA tournament begins, many different media outlets like to post their favorite Giant Killers. These are lower-seeded teams that have a good chance of pulling off an upset in the first round. However, often times these teams are one-and-done deals, flaming out in the second round after their game of glory in the first round. There is a big difference between Giant Killers and teams that can become a Cinderella and advance into the second weekend of the tournament.
Recent evidence suggests that non-conference strength of schedule could be a solid predictor of tournament success. The following model does not include strength of schedule, but it does include a whole lot of other things. The model is built with team-level KenPom advanced statistics from 2004-2015. Because success in the NCAA tournament weighs heavily on how well each team matches up with its opponent, this is one way of trying to quantify that success based on match-ups at the team level. That means no strength of schedule, no seeding information, no lottery player bias, etc.
Finding Diamonds in the Rough
Starting with 26 advanced statistics for both favorites and underdogs, the model utilizes a logistic step-wise regression, estimating the win probability for each team in Rounds 1 and 2. When trying to predict first round success with these statistics, a few statistical indicators stood out. First, both an underdog’s and a favorite’s Adjusted Offensive and Defensive Efficiencies are great predictors of a team’s tournament success. Other important factors that play into determining a first round upset seem to hinge on turnovers and three-point shooting. According to the model, the most important traits that an underdog can have are being able to turn over its opponents and shoot a high rate of threes. An underdog is much more likely to pull an upset if they are adept at forcing teams to throw the ball away on a larger share of their possessions and make favorites pay for those turnovers by hitting threes. The most important traits that favorites must posses if they wish not to beaten in Round 1 is a suffocating defense and the ability to make free throws. This makes some intuitive sense, as a high scoring underdog may be able to get hot and run-and-gun its way to an upset. A good defense would likely be a solid detractor of that possibility. Free throw shooting becomes important if an overmatched, underdog defense becomes reliant on fouling in order to slow down their more-talented opponents.
After the first round, the model moves on to selecting important factors for upsets in Round 2. When teams get to the second round, many of the same factors that predict Round 1 success also seem to carry over to Round 2, such as the favored team’s stifling defense. However, as teams get out of Round 1 and get deeper into the tournament, it seems that overall athleticism comes to mean a bit more. For Rounds 2-4, the most important indicator for an underdog is not a traditional stat, but rather the percentage of its shots that it has blocked by the defense. This pattern may define some amount of athleticism (or lack thereof) for the underdog, as a smaller, less athletic team may be prone to having its shots blocked by longer, quicker defenses. For the favorite, it’s more of the same sentiment. In Round 2 and on, the rates at which favored defenses get steals and defend the three-point line are often indicative of success. Both of these stats could reflect athleticism, as longer, quicker teams can get their hands into passing lanes and up to defend the outside jump shot.
Giant Killers and Cinderellas
Below are the results of the model, with each team’s percentage chance of winning in Round 1, Round 2, and their chances of making the Sweet 16.
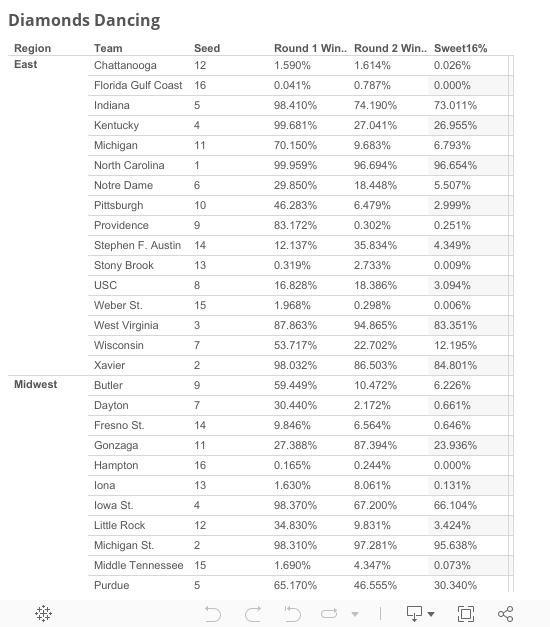
As we look at the results of the model, a few patterns emerge:
• The model is incredibly confident in a lot of 8/9 and 7/10 picks. At times, the model is too confident. As these match-ups are the hardest to predict, this is where the model is the least accurate, though not by much. Testing the model on tournament data from 2002 and 2003, the model still managed to pick about 75% of the match-ups correctly. In terns of total accuracy, the model correctly predicted 83% of all match-ups .
• In terms of Giant Killers, or teams that may be in line to pull a big upset in Round 1, the model likes the First Four participants, 11-seeds Wichita State and Michigan/Tulsa. Interestingly enough, a team from the First Four has made the Round of 32 each year since the First Four’s inception in 2011. Also look out for Little Rock, Northern Iowa, and Gonzaga as double-digit seeds.
• Stephen F. Austin is an interesting case this year. In Round 1, they have a 12.1% chance of beating West Virginia in the East Region. However, if they somehow manage to pull the upset, their chances of winning in Round 2, sit at 35.84%, against either Notre Dame (more on them in a bit) or Michigan/Tulsa . According to the model, S.F. Austin’s Round 2 winning percentage would be the highest for a 13-seed or worse facing at least an 11 or better seed since KenPom started keeping advanced stats.
• If we’re talking Cinderellas, the model particularly likes Iowa, giving them a 73% chance of making the Second Weekend, likely taking down Villanova on the way. Along with Iowa comes Wichita State and VCU as the most likely double-digit seeds to make the second weekend.
• According to historic model estimates, UNC Asheville sits as the 6th mostly likely 15-seed to win a first round match-up since 2002. 2 of those 5 15-seeds (2013 Florida Gulf Coast and 2012 Lehigh) with at least a 5% chance to win in Round 1 won their match-ups. If you NEED to pick a 15-seed, you might consider UNC Asheville.
• The model doesn’t seem to like Notre Dame in either the first or the second round. In fact, Notre Dame is the only Top 6 seed that has a winning percentage lower than 30% in both Round 1 and Round 2. This could be because Notre Dame doesn’t really excel in many categories that the model values. They are an average team on defense, allowing 1.037 Points Per Possession, equal to the NCAA D1 average . They don’t turn the ball over, though they don’t force turnovers either, giving the ball away on 14.8% of their possessions and forcing the same percentage on defense. Finally, they don’t guard the 3-point line particularly well, allowing opponents to shoot 37.6% from behind the arc on nearly 20 attempts per game.
Disclaimers
A point to remember when looking at this model: It is a logistic regression, meaning that it measures a team’s chances of winning a game in percentages. That seems fitting for March Madness, considering that anything can happen. Even teams with less than a 1% chance of winning have won in the past. Models like these can give you a solid prediction of what may happen, but nothing is certain. That’s why the boys lace ‘em up and why we watch them. Good luck picking your brackets, enjoy the Madness, and continue to pray for the return of Gus Johnson to the NCAA Tournament sidelines in the near future.
The post Diamonds Dancing: Predicting the Madness first appeared on 'CATS STATS.
]]>The post Talking it Over: Efficiency After Timeouts first appeared on 'CATS STATS.
]]>
Often times during a TV broadcast of a basketball game, fans will hear broadcasters exclaim, “What a great play coming out of the timeout. [Coach X] drew that one up to perfection!” Broadcasters may even refer to specific coaches as experts in their ability to focus a team strategically during a timeout. But other than those occasional plays that excite broadcaster and fan alike, what evidence do we have that certain teams are better than others coming out of a timeout?
College coaches use most of their timeouts for two reasons: to stop another team’s run of scoring or to talk over strategy in pivotal moments of a game. In either situation, it is a positive sign if, after the timeout, a team’s offense converts the next possession into points. A way to measure this kind of offensive output out of timeouts is to look at how efficiently a team’s offense performs in the possessions immediately after a timeout. In this instance, we’ll look at Points per Possession on plays immediately following a timeout. Below is a graph of all NCAA Division I teams’ average PPP in possessions after timeouts over the last seven seasons (2008-2009 to 2014-2015) and their standard deviations from the same measure.

As we can see, most team’s PPP out of timeouts vary quite a bit from year to year. This isn’t terribly surprising, as this same pattern appears year to year in the NBA. Most teams rarely rank in the same spot more than a couple of years in a row. The variation for out-of-timeout PPP isn’t quite as pronounced as the NCAA, likely because there are fewer teams in the NBA, so the deviations in PPP ranking are most visible. With an exception of a few teams, most teams have experienced at least one large jump or fall throughout PPP rankings over the last 7 years. Only three teams in the country were in the Top 10 percent in both standard deviation of out-of-timeout PPP and average out-of-timeout PPP. Translation: It’s hard to be consistent out of timeouts. It’s even harder to be consistently GOOD out of timeouts.
The three teams that seem to consistently execute well after timeouts were Northwestern, Duke, and Cal. Northwestern, under both Bill Carmody and Chris Collins, seems to excel after timeouts, averaging about 0.9 PPP. Cal did very well after time outs while headed by Mike Montgomery, though his recent retirement may cause the Golden Bears to take a step back, as current coach Cuonzo Martin has the team operating at about 0.05 PPP below their 7-year average. Finally, there’s the Duke Blue Devils. Duke, over the last 7 years, has averaged 0.953 PPP out of timeouts, .137 PPP better than the average Division I squad. How are the Blue Devils doing this? It could be superior athletes, a high-ranking academic atmosphere, or one of the greatest basketball coaches the world has ever seen. At the end of the day, it is likely a combination of all of those things. Nevertheless, given the variability of this data, it is quite amazing how the Blue Devils can perform so incredibly well after timeouts with their level of consistency.
As for Davidson, Coach McKillop also has the boys operating at an impressive level. Davidson comes in at 16th in Division I for average PPP out of timeouts over the last 7 years. Davidson isn’t quite as high in terms of variance, with their Standard Deviation coming in at 0.750 PPP, good for 166th in D1. However, that 0.750 PPP is still 0.041 PPP better than the D1 average. By executing at a high level and an above-average efficiency, Davidson fans can expect that the ‘Cats will break each huddle with a quality plan to score on the next possession.
The post Talking it Over: Efficiency After Timeouts first appeared on 'CATS STATS.
]]>The post “Born to Run”: Searching for a New “Pace” Statistic first appeared on 'CATS STATS.
]]>
Here at ‘Cats Stats, along with giving our readers some interesting new ways to think about how basketball is played, we also aid Davidson Basketball (and many other Davidson Varsity sports), in pre-game preparation. This means it is our job to find ways to increase Davidson’s knowledge of both its opponents and own team. Coaches and players then use this knowledge to design and execute a gameplan, offensively and defensively.
In basketball, scoring points comes in a variety of forms. The University of Wisconsin, for example, historically has played at one of the slowest rates in college basketball. Using a slow, methodical offensive attack, the Badgers often use the full shot clock to probe a defense in order to find a quality shot. On the other end of the spectrum, the North Carolina Tar Heels historically prefer to get up and down the floor quickly, attempting to score before the opposing defense has time to get set. Each of these offensive strategies has the capacity to be effective, as both of these teams ranked in the Top 30 in Points Scored Per Possession in the 2014-2015 college basketball season.
Since teams vary in their offensive pace, quantifying this allows for numerical comparison of teams’ offenses. The value of such comparisons depends, of course, on the underlying metric. One of the most widely accepted measures of pace is simply the number of possessions that a team creates per 40 minutes. This statistic certainly does give viewers an indication of how fast a given team plays on offense, as more possessions per game mean a shorter, quicker time of possession. But what about defense?
Possessions per 40 minutes statistics give no indication of how well or how poorly a team may defend its opponents pace of play. Winning games is a combination of offense and defense; a team must be efficient in scoring points with its own possessions while using its defense to stop the other team from scoring points. NylonCalculus.com recently unveiled a way to quantify both offensive and defensive pace measures.
Nylon Calculus, for those who don’t know, is one of the most prominent basketball blogs on the web. Seth Partnow, editor of Nylon Calculus, explained his feelings regarding possessions per game in an October 9th article:
“I’ve never been particularly happy with ‘pace’ as a statistic, at least not as a measurement of anything with much meaning beyond simple possessions counts. So many things can cause the pace statistic to diverge from what we are really looking for the stat to measure, which is speed of play. Offensive rebounds, particularly good or bad defense, or even something crazy like the employment of a ‘hack-a’ strategy can cause the number of possessions to expand or shrink in ways that don’t readily reflect the quickness of a team’s offense.”
In response to these concerns, Partnow created a couple of new statistics that we believe are an effective way of measuring pace: Offensive Transition Percentage, Defensive Transition Percentage, and a team’s Speed Index. Offensive Transition Percentage is calculated simply by taking a team’s number of Transition Opportunities per game (a statistic measure by Synergy) and dividing it by the sum of a team’s Defensive Rebounds and Steals per game.
 This sum represents the total opportunities of a team to convert a possession into a transition opportunity. Defensive Transition Percentage is calculated the same way, except Transition Opportunities allowed, Defensive Rebounds allowed, and Steals allowed per game are the statistics used.
 These two statistics allow the viewer to see the percentage of live-ball, offensive opportunities that a team converts into transition opportunities, and, on defense, how effective a team is at restricting their opportunities from those same transition opportunities. Finally, a team’s speed index is its Defensive Transition Percentage subtracted from its Offensive Transition Percentage.
 This value represents how much faster or slower a given team plays in comparison to its average opponent.
Partnow then took these statistics and applied them to each and every NBA team for the 2014-2015 season. The results are shown in the graph below:
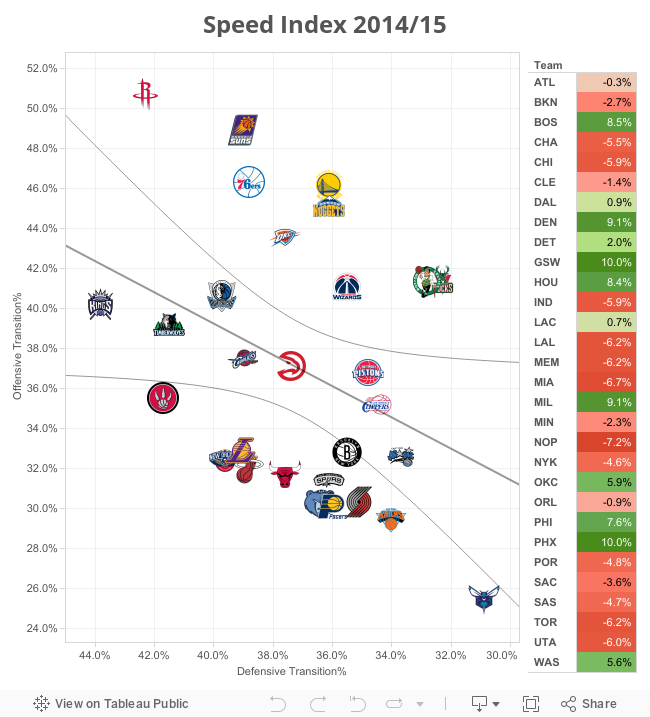
As we can see, teams near the bottom right of the graph, such as our hometown Charlotte Hornets, don’t often get out in transition, but are very successful in stopping their opponents from creating transition chances. Conversely, the quick-paced Houston Rockets, located at the top-left of the graph, are very good at creating transition chances, but also poor at eliminating their opponent’s transition chances. The Golden State Warriors, led by former Wildcat Stephen Curry, were quite adept at both creating their own transition chances and restricting their opponents transition possessions, as shown by their top-right location on the graph. Not surprisingly, this high level of transition efficiency resulted in the Warriors having the fastest Speed Index in the entire NBA, a quality that helped them capture the 2014-2015 NBA Championship in June.
After seeing Partnow’s work with these pace statistics and its application to NBA teams [1], we had the idea to try to apply that same work to NCAA teams. Below is a graph displaying the average offensive and defensive efficiency of each NCAA Division I Men’s Basketball Conference:
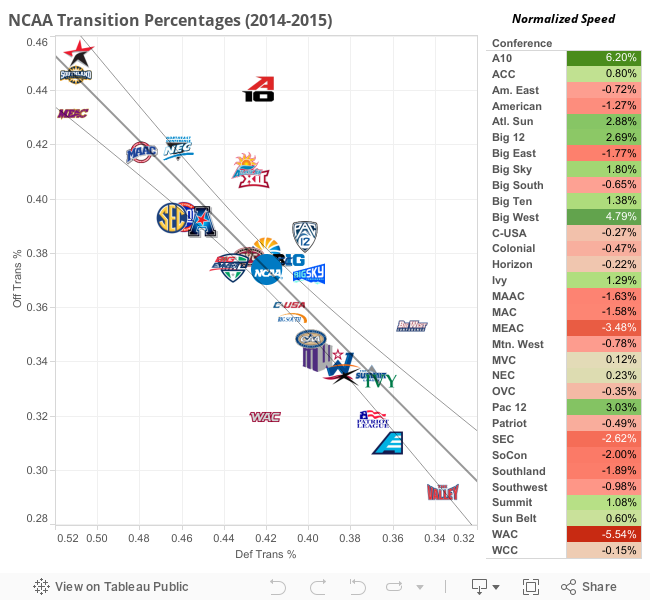
On the side bar, each conference’s Normalized Speed Index is listed. Speed Index needs to be normalized because the average NCAA speed score is actually negative. This effect is caused by outlying teams in each NCAA conference with poor speed scores, forcing the average speed score to be pulled down. As a result, the Normalized Speed Score is the percentage that a conference is above or below the NCAA average Speed Score.
As one can see, conferences that are significantly above the best fit line on the graph are “faster” conferences, while teams far below the best fit line are “slower” conferences, on average. The conference to which the Davidson Wildcats belong, the Atlantic 10, was the fastest conference in the country last year, in terms of Normalized Speed. Davidson’s former conference, the Southern Conference, can be seen near the lower confidence interval line, indicating the SoCon’s slower pace of play. In retrospect, Davidson’s move the the Atlantic 10 in 2014 represented a jump from last year’s 3rd-slowest Division I conference to the the fastest conference in America.
Information like this is crucial to coaches, players, and even fans. Preparing for a fast-paced team can differ from preparing for a slower paced team, as a coach’s scheme may differ depending on the opponent’s pace preferences. For example, against a team that likes to get out in transition, a coach may be wary of crashing the offensive glass, and opt to send players back on defense instead. Here we see that conference play can result in such differences, which can be especially important if a team’s style varies or struggles against faster or slower paced teams.
Interestingly, if we look at both the Big Ten conference and the Atlantic Coast Conference, homes of the Wisconsin Badgers and North Carolina Tarheels, respectively, we will see that both of these conferences actually play a similar, fairly average pace. Both teams are significant outliers in their respective conferences, with Wisconsin being on the slower end of the spectrum and UNC being on the faster side. That being said, just because a conference plays at a seemingly average pace, teams must still be able to account for each and every individual team they face, as pace of play within each conference varies at different degrees
This type of metric can give teams an idea of which opponents they should attempt to create more or less transition opportunities against, as well as in which games they need to be wary of a specifically successful offensive transition team. What about team-by-team analysis? After all, we did just explain how individual team-by-team match-ups could be much more important than a conference level statistic. Well, we’re keeping those numbers behind closed doors for now. We can’t give out all of our secrets right away, but if you keep checking the site, we might just quench your thirst for more ‘Cats Stats.
[1] http://nyloncalculus.com/2015/10/09/nba-speed-index-team-transition-chances/
The post “Born to Run”: Searching for a New “Pace” Statistic first appeared on 'CATS STATS.
]]>