Here at ‘Cats Stats, along with giving our readers some interesting new ways to think about how basketball is played, we also aid Davidson Basketball (and many other Davidson Varsity sports), in pre-game preparation. This means it is our job to find ways to increase Davidson’s knowledge of both its opponents and own team. Coaches and players then use this knowledge to design and execute a gameplan, offensively and defensively.
In basketball, scoring points comes in a variety of forms. The University of Wisconsin, for example, historically has played at one of the slowest rates in college basketball. Using a slow, methodical offensive attack, the Badgers often use the full shot clock to probe a defense in order to find a quality shot. On the other end of the spectrum, the North Carolina Tar Heels historically prefer to get up and down the floor quickly, attempting to score before the opposing defense has time to get set. Each of these offensive strategies has the capacity to be effective, as both of these teams ranked in the Top 30 in Points Scored Per Possession in the 2014-2015 college basketball season.
Since teams vary in their offensive pace, quantifying this allows for numerical comparison of teams’ offenses. The value of such comparisons depends, of course, on the underlying metric. One of the most widely accepted measures of pace is simply the number of possessions that a team creates per 40 minutes. This statistic certainly does give viewers an indication of how fast a given team plays on offense, as more possessions per game mean a shorter, quicker time of possession. But what about defense?
Possessions per 40 minutes statistics give no indication of how well or how poorly a team may defend its opponents pace of play. Winning games is a combination of offense and defense; a team must be efficient in scoring points with its own possessions while using its defense to stop the other team from scoring points. NylonCalculus.com recently unveiled a way to quantify both offensive and defensive pace measures.
Nylon Calculus, for those who don’t know, is one of the most prominent basketball blogs on the web. Seth Partnow, editor of Nylon Calculus, explained his feelings regarding possessions per game in an October 9th article:
“I’ve never been particularly happy with ‘pace’ as a statistic, at least not as a measurement of anything with much meaning beyond simple possessions counts. So many things can cause the pace statistic to diverge from what we are really looking for the stat to measure, which is speed of play. Offensive rebounds, particularly good or bad defense, or even something crazy like the employment of a ‘hack-a’ strategy can cause the number of possessions to expand or shrink in ways that don’t readily reflect the quickness of a team’s offense.”
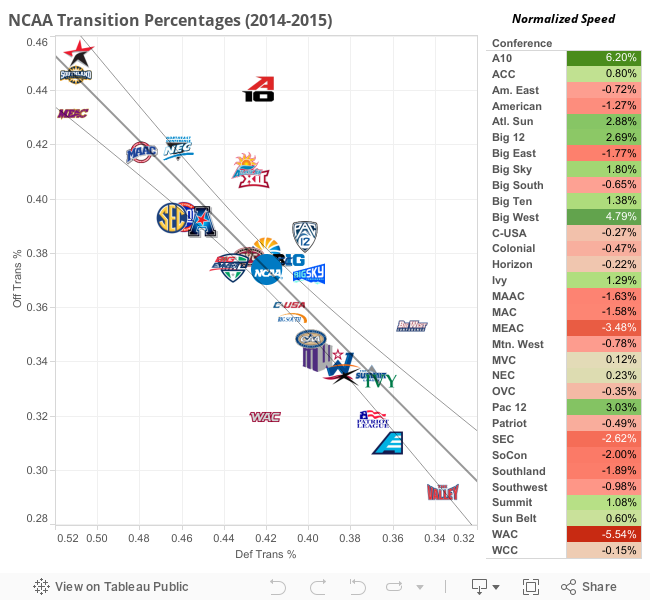
In response to these concerns, Partnow created a couple of new statistics that we believe are an effective way of measuring pace: Offensive Transition Percentage, Defensive Transition Percentage, and a team’s Speed Index. Offensive Transition Percentage is calculated simply by taking a team’s number of Transition Opportunities per game (a statistic measure by Synergy) and dividing it by the sum of a team’s Defensive Rebounds and Steals per game.
 This sum represents the total opportunities of a team to convert a possession into a transition opportunity. Defensive Transition Percentage is calculated the same way, except Transition Opportunities allowed, Defensive Rebounds allowed, and Steals allowed per game are the statistics used.
 These two statistics allow the viewer to see the percentage of live-ball, offensive opportunities that a team converts into transition opportunities, and, on defense, how effective a team is at restricting their opportunities from those same transition opportunities. Finally, a team’s speed index is its Defensive Transition Percentage subtracted from its Offensive Transition Percentage.
![]() This value represents how much faster or slower a given team plays in comparison to its average opponent.
This value represents how much faster or slower a given team plays in comparison to its average opponent.
Partnow then took these statistics and applied them to each and every NBA team for the 2014-2015 season. The results are shown in the graph below:
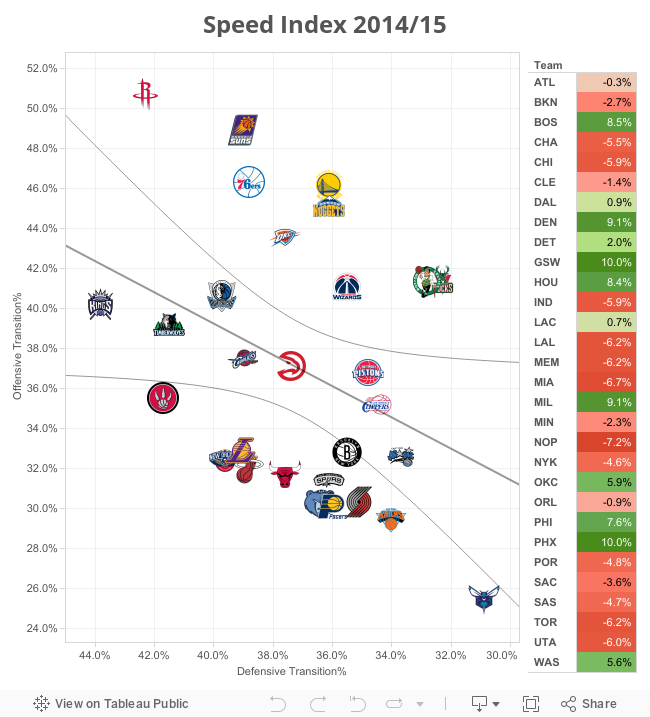
As we can see, teams near the bottom right of the graph, such as our hometown Charlotte Hornets, don’t often get out in transition, but are very successful in stopping their opponents from creating transition chances. Conversely, the quick-paced Houston Rockets, located at the top-left of the graph, are very good at creating transition chances, but also poor at eliminating their opponent’s transition chances. The Golden State Warriors, led by former Wildcat Stephen Curry, were quite adept at both creating their own transition chances and restricting their opponents transition possessions, as shown by their top-right location on the graph. Not surprisingly, this high level of transition efficiency resulted in the Warriors having the fastest Speed Index in the entire NBA, a quality that helped them capture the 2014-2015 NBA Championship in June.