

When we think of a pitcher’s production, most people will bring up two statistics: wins and earned run average (ERA). But in the sabermetrics era, researchers have found that in reality, one of these two stats is highly controlled by other means. Wins are a product of both the offensive results of the pitcher’s team and are not an isolated measure of a pitcher’s ability, rather they are indicative of a collective team’s results that just happen to be assigned to an individual player. Earned run average is a solid statistic that displays a good sense of a pitcher’s performance (runs allowed while pitching minus some outside factors) in one value. However, ERA is still influenced by factors that the pitcher cannot control, such as the defensive skill of the pitcher’s fielders (converting outs on non-routine plays) and the opponent’s baserunning skills (going from first to third on a single, for example). The statistic known as BABIP, batting average on balls in play, has an average value of close to .300 every season for the majority of baseball’s history. Once a ball is put into play, thousands of variables affect the play’s result. Thus, these lucky or unlucky bounces could eventually help or hurt a pitcher’s earned run average. This is why several analysts in the 2000s admitted that pitchers should be judged for solely outcomes they can control: walks, strikeouts, and home runs. When a ball is put in play and stays in the park, hard hit balls can become outs, and weakly hit balls can become base hits. Walks, homers, and strikeouts are arguably the most effective ways in today’s era to judge the effectiveness of pitchers. A statistic known as FIP was created by statisticians Tom Tango and Clay Dreslough that measure a pitcher’s “True ERA” with walks, K’s, and homers taken into account, adjusted to scale of the ERA statistic. FIP is computed by the equation

where is a constant which takes the run-scoring environment into account, which recently has hovered around 3.2.
Just for fun, I decided to include ground ball to fly ball ratio as a fourth factor into the calculation of what I call truERA, as I believe that pitchers that draw more ground balls and fewer fly balls take away line drives, which have higher probabilities of extra-base hits. More ground balls will result in fewer total bases and more double plays. I adjusted each statistic from its MLB average (K/9, BB/9, HR/9, and GB/FB) while weighting them (with K’s, BB’s, HR’s, and GB/FB in order of most to least heavily weighted) and setting the average truERA to the mean ERA of the period, giving me the formula

where the weighted variables are set to 100 as the MLB average and adjusted based on relative distance from the average. Above-average values for each statistic have weighted coefficients higher than 100, and conversely less than 100 for below-average results. Finally, A represents the average ERA for the period.
I wanted to know which pitchers have been the most unlucky over the past few years, or the ones that have their ERA significantly higher than their truERA, and vice versa. Remember that ERA is one of the “holy grail” statistics used in baseball writer and fan voting for major awards such as All-Star representation, Cy Young Awards, Rookie of the Year and ultimately the Hall of Fame.
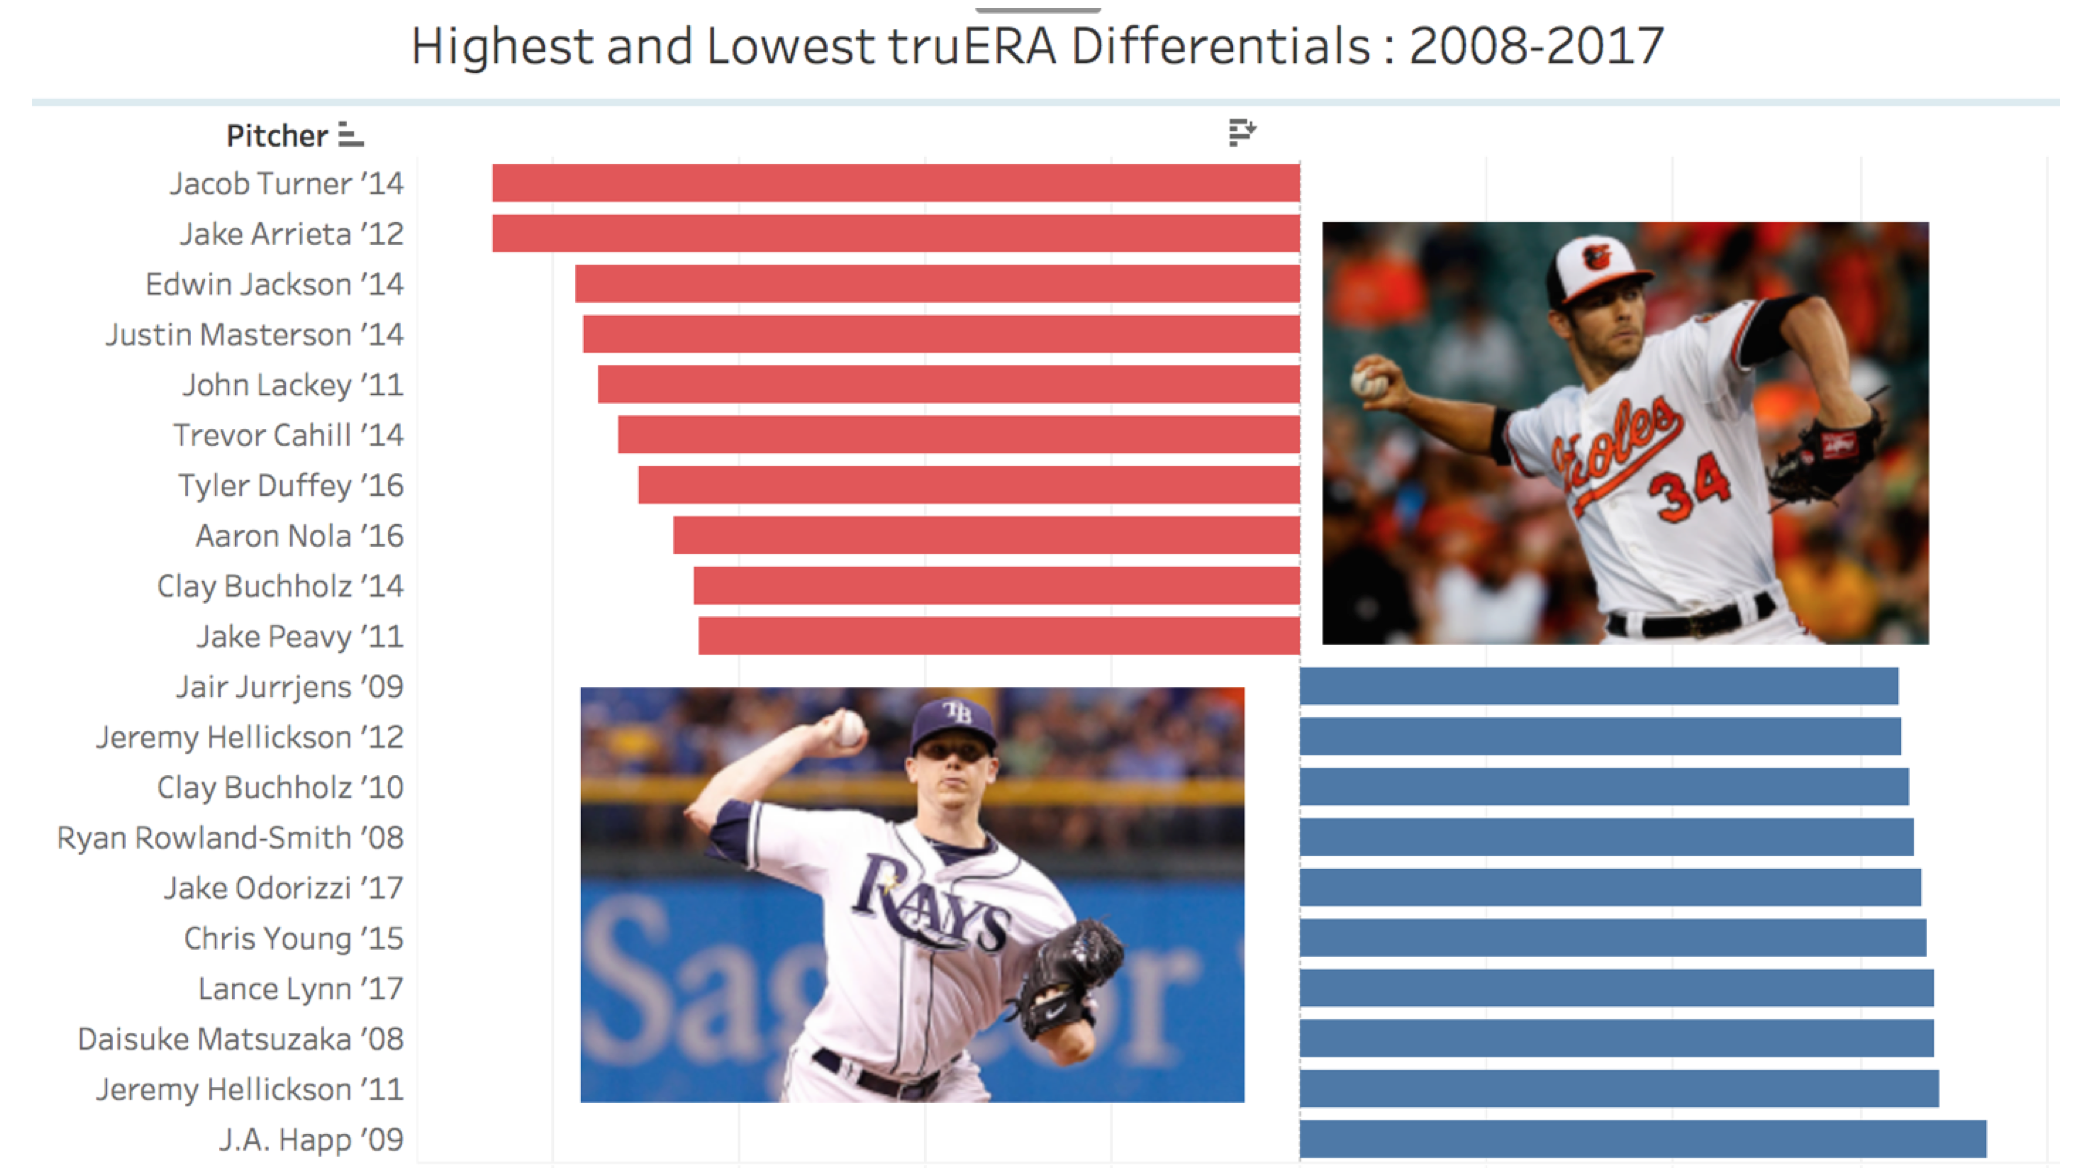
Let’s look at the luckiest and most unlucky individual seasons in the last ten years. We are measuring truERA- ERA; meaning lower values( to the left of the y-axis) are unlucky and higher values (to the right of the y-axis) signify the pitcher was lucky.

Jake Arrieta may have been well undervalued after that 2012 season in Baltimore with a 6.2 ERA, but he sure delivered the goods after he was sent to the Cubs in mid -2013 before having a dynamite 2015 going 22-6 with a 1.77 ERA and taking home the Cy Young. Definitely something that the O’s probably regretted later. How about Aaron Nola? After an unlucky 2016, he goes under a 4.00 ERA in 2017 and then becomes an All-Star in 2018 with a strong 2.42 mark (as of September 16). Good thing the Phillies were patient. Jake Peavy’s mediocre 2011 gave way to a 3.37 ERA in 2012 and his third and final All-Star appearance. Jacob Turner looks like the one exception in this list who pitched poorer after a significant unlucky season, but he only threw 24.2 innings after not pitching in the majors for a year. On the other side, we see (the pitcher) Chris Young’s great output of 3.06 in his first season at Kansas City, but it was a very lucky one when he was 36 years old. Sure enough, he struggled in 2016 with an ERA over 6 and didn’t last much longer. Old players with large positive truERA – ERA differences should not be valued very high, besides maybe those with significantly low ERAs. Finally, Jeremy Hellickson appears on the list twice. Those were his best two years ERA-wise (2.95 in 2011 and 3.10 in 2012), and his luck didn’t last forever. He never went under an ERA of 4 again until 2016. Luck does seem to correct itself many times. It is interesting to see Clay Buchholz’s name on both sides of the list, and in both years the projections were correct. His career has resembled that of a rollercoaster with his varying fluctuations of performance, from All-Star years to very much below average years, with injuries along the way. But the factors of homers, walks, strikeouts, and ground balls can give us a direction of where the rollercoaster is heading. All of the lucky pitchers mentioned worsened their performance in the player’s following season.
So, can we use this information to predict how well a pitcher will play in the future? Certainly. I took the last 25 years of MLB pitching data for all pitchers over 100 IP for each season and found their truERA- ERA difference. Using this, I found the difference between next season and this season’s ERA, eliminating any extraneous data with very few innings pitched in the pitcher’s next year. This is the plot I came up with, using the fifty luckiest and fifty unluckiest seasons from the last quarter-century. I call the first year Season A, and the second year Season B to determine the change in ERA or performance difference from A to B. Remember, the “unlucky” pitchers are on the left side of the y-axis, and the “lucky” ones are to the right.
The change in ERA performance is indicated by the y “value” on the chart, so improvers are below the x -axis, and those who got worse are above the x-axis.

This totally makes sense. Pitchers who were “unlucky” or had their truERA lower than their actual ERA, tended to decrease their ERA the next season, while lucky players tended to hike their earned run average. It seemed that the luckier pitchers were suffering more afterwards than the unluckier pitchers were improving by the increase of outliers on the right side of this graph.
Based on my research, I have identified pitchers who are projected to improve their performance in 2019 from their body of work in 2018. The hurlers with red numbers signify that they could get “hotter” next year and the blue meaning that the player could turn “colder”.

At the top is Marcus Stroman, who has an extremely high ground ball/fly ball rate of 1.73, along with an above-average HR/9 of .8, and should theoretically allow fewer total bases and therefore runs created in the future if he continues his track. Jason Hammel is on the list, but keep in mind that he is 36 years old and is nearing the final years of his career. Hammel’s low walk rate could keep him in the league a little while longer. Former All-Star Sonny Gray has nearly a 5.00 ERA for the Yankees, but has a decent HR/9 (1.0) and K/9(8.4) that could possibly give him above-average production again next season.
We see some All-Stars also on the other side of this list, like Folty and Snell who are candidates for regression, along with veteran Madison Bumgarner, who may be already past his peak at age 29. Mike Fiers is 5-1 with his new team, the Oakland A’s. But his high home run rate (including seven in his last four starts) combined with a below average strikeout rate this season could potentially hinder him and his team in the postseason and into next year.
The previous results and possible indicators give us a clear message that using walk, strikeout, home run, and ground ball/fly ball rates can be very predictive of improvements and faltering of pitchers in Major League Baseball and can have great value in deciding pitchers that will be helpful to clubs in the future.