

It’s April again, so NHL playoff season is officially upon us once again. As the field has been determined, the next logical step is to guess who will win each series and who will ultimately end the summer with a Stanley Cup. With the unpredictability of the playoffs, though, predicting the winners can seem like a daunting task. The President’s Trophy curse is real: the team finishing on top of the NHL has only won the Stanley Cup eight of the thirty-three times it’s been presented. Then again, we haven’t seen a team as good as the Tampa Bay Lightning, who finished on top this year with 128 points, in decades… can they break the curse? Will Vegas make another astounding run? Will Carolina surprise us all after making the playoffs for the first time in ten years? Different people have different ways of trying to address this madness, whether it’s the eye test, standings comparisons, or numbers and stats. We decided to use JMP to analyze team-level data from the 08-09 season through the 17-18 season, downloaded from Moneypuck.com, to find predictors for playoff success just in time for the first puck drop of the 2019 Stanley Cup Playoffs.
The strategy here was to put the data into JMP, isolate the data of teams who made the playoffs in each year and exclude non-playoff teams, and have the JMP Partition tool identify, based on the Log Worth value of the parameter, the most predictive indicators of playoff success. The data were then charted in Tableau to identify whether or not there was any significant trend. Here are the predictors we found to be most significant:
EXPECTED GOALS FOR (xGF) / EXPECTED GOALS FOR PERCENTAGE (xGF%): Expected goals for, which is the sum of all the probabilities of a team’s unblocked shots going in the net (so, for example, a shot with a 15% probability of being a goal has an xG value of .15), is a stat that is being used more and more in hockey analytics. xGF takes into account shot quality as well as shot volume and for that reason is more useful in determining a team or individual’s offensive value. xGF%, then, is the ratio of a team’s xGF to the total xGF (team xGF + opponent xGF). A team with greater than a 0.5 xGF% is controlling the majority of the game’s shot quality and volume. In the case of both xGF and xGF%, there is a fairly significant linear relationship between each stat and playoff rounds won:


In the case of xGF%, there seems to be a significant difference between teams who lose in the first round and teams who lose in the second round. After the first two rounds, the differences level off and become more linear. We see a similar trend in the xGF values between the teams who match up in the conference finals; the teams who lose have significantly lower xGF values than the winners. The teams that make the deepest runs are the ones who are getting a significant number of high-danger shots and who are recording more of those shots than their opponents.
5-ON-5 SHOTS ON GOAL FOR (SOG): Simply put, 5-on-5 SOG are the number of shots a team recorded at even strength that resulted in either a goal or a save by the opposing goalie. The trend here is interesting:

There really isn’t much of a difference between the teams who take a first-round exit and the teams who take a second-round exit. Once you get to the conference finals, though, the men are separated from the boys. The teams who get to the Stanley Cup Final, and those who ultimately win it all, have significantly higher SOG volumes at 5-on-5 than the teams who take early exits. Remember, this data is regular season data, so the upward trend is not explained by the fact that the teams who go deeper in the playoffs play more games and have more chances to get more shots on goal. It seems that high-volume shooting teams are well-suited to make a run.
FENWICK PERCENTAGE: Fenwick percentage measures how well a team controls shot attempts. It’s calculated by dividing a team’s unblocked shot attempts by the sum of the team’s unblocked shot attempts and the opponent’s unblocked shot attempts. Fenwick is thought to be a better predictor of long-term success than its counterpart, Corsi, which takes into account shot attempts that were blocked by the opponent. Fenwick, simply speaking, is an indicator of controlling the game offensively.

We see that the separation again comes in the conference finals. There’s generally not much difference in Fenwick percentage between the teams in the Final, but the teams with lower percentages generally are rooted out early, leaving the top offensive machines to duel it out.
LOW DANGER GOALS AGAINST (LDGA): Low danger goals against are defined to be goals that the opponent scores that had a less than 8% chance of going in the net when the puck was shot. High numbers of low danger goals against are an indicator of either bad or volatile goaltending. Teams playing defense are going to try to force their opponents to shoot as high a percentage of low danger shots as possible to decrease their opponent’s chances of scoring, and at that point, the burden is on the goalie to save a shot that statistically should not enter the net.

Here’s the inverse relationship we were expecting. Cup-winning teams have reliable goaltending and force their opponents to seek high-percentage shots in order to score. We do see an inversion of this otherwise downward-sloping curve in the second round, as teams who make it to the conference final allow more low danger goals against than the teams they beat in the second round. A possible explanation could be the recent reformatting of the playoff structure, which has been known to pit two powerhouse teams together in the second round rather than the conference final (RIP reseeding), leading to the possibility of the team with the lower LDGA value moving on. It’s also indicative of the fact that a clear separation between teams with better goaltending and defense doesn’t come until later in the playoffs. Either way, if a team’s opponent isn’t scoring low-percentage goals, that team has a significant tool in their toolbox.
GOALS FOR (GF): Goals for is a stat that’s fairly self-explanatory. If your team scores a goal, your team has a goal for. It should be noted that the trend here is far less significant than the others, but still worth noting:
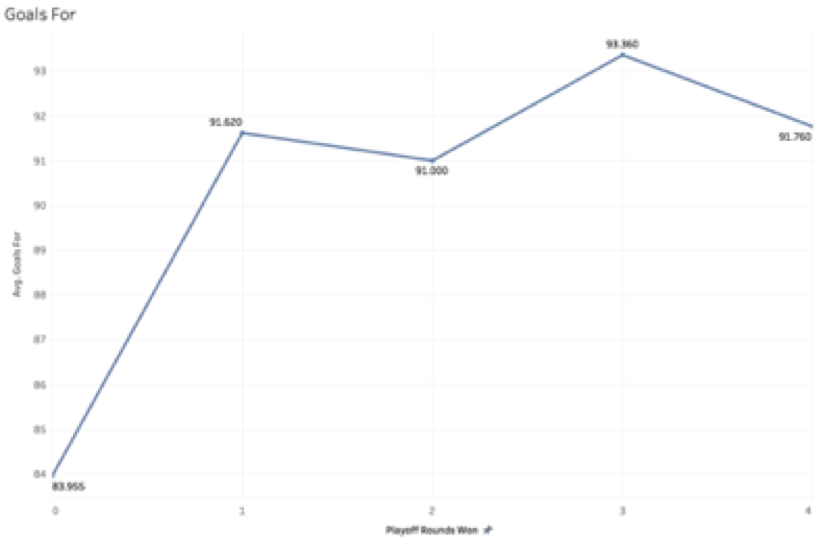
What we see here is that if a team wants to make it out of the first-round gauntlet, it needs to be a proven scoring team. Only teams that can put the puck in the net make it to the second round and beyond.
Another interesting note is which stats AREN’T good predictors of playoff success. Most notable is power play percentage. It’s bolded here because of the amount of times one can hear experts talking about how a team’s dynamic and prolific power play will take them far in the playoffs (hint: it’s a lot). POWER PLAY PERCENTAGE IS NOT A GOOD PREDICTOR OF PLAYOFF SUCCESS. In fact, it’s pretty terrible. Look for yourself:
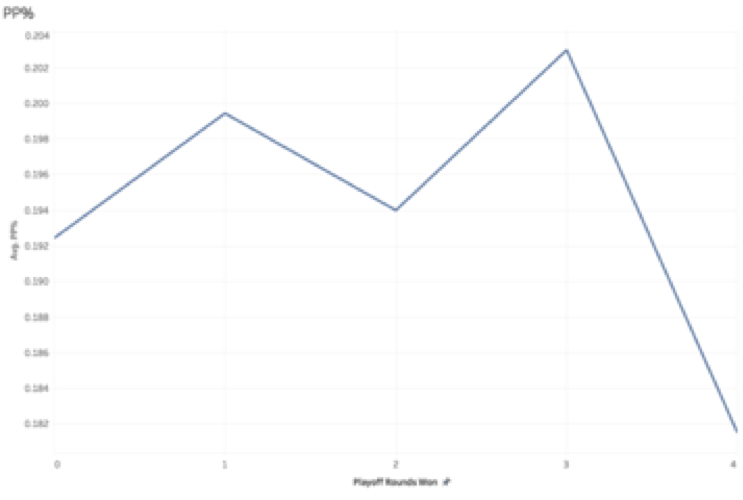
It doesn’t take an expert in statistics to see that there’s no trend there. Penalty kill percentage is a better predictor than power play percentage, but even that isn’t a very reliable indicator. Don’t fall into that trap. Shooting percentage and save percentage, too, are fairly bad tests for playoff success, as there’s no correlation whatsoever between those stats and number of playoff rounds won.
So which teams are in a good position headed into the playoffs? Here’s a chart for comparison:
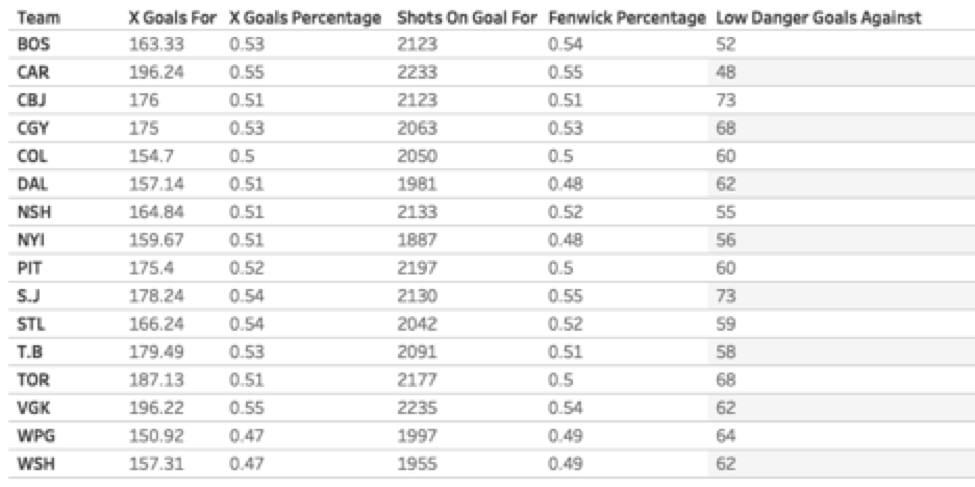
Carolina and Vegas highlight the top of the expected goals leaderboard, with Toronto close behind. Colorado and Dallas find themselves at the bottom. The Canes and Golden Knights also share a significantly higher proportion of shot quality and volume compared to their opponents, while Winnipeg and Washington generally see their opponents control those parameters. It shouldn’t come as a surprise, then, that the same two teams, Vegas and Carolina, lead the playoff teams in 5-on-5 SOG, while the Islanders find themselves lacking in that department. San Jose leads the way in Fenwick percentage, with Vegas, Carolina, and Boston all breathing down the neck of the Sharks. In terms of low danger goals against, the Blue Jackets and Sharks could use some help, as they each allow significantly more low-percentage goals than the teams at the top – Carolina and Boston.
The numbers are favorable for Vegas, Carolina, and Boston all to make deep runs this year, while Winnipeg and Washington may disappoint, as the numbers indicate that they don’t produce enough high-danger chances, and they generally allow their opponents to hold the advantage in offensive possession and quality. Of course, these are the Stanley Cup playoffs, and while we can attempt to use numbers to interpret the mayhem, at the end of the day, the teams that move on are the ones who throw the regular season out the window and elevate their games to another level. Fill out a bracket, sit back, and watch the intensity of playoff hockey unfold.