

Until last year, the 1-vs-16 match-up in the NCAA basketball tournament had been a mere formality since the tournament expanded to 64 teams in 1985. 1 seeds were undefeated with 135 wins against 16 seeds in that time span, and coming into the 2018 tournament, there was no indication that the unbeaten streak would end. The most discounted matchup was that between Virginia, the top seed in the tournament, and the 16seeded UMBC Retrievers, a team which many had never heard of and which few gave any chance. At a glance, it wasn’t close; UVA boasted a 31-2 record and an ACC championship, and though their offense didn’t dazzle (averaging 67.1 PPG, good for 314th in the NCAA), they boasted one of the best defenses in the country. UMBC, the America East champions, had the nation’s 36th weakest schedule according to KenPom and came in with a middle-of-the-road 25-11 record. Could anyone have possibly made a statistics-based prediction of UMBC’s unprecedented upset of the tournament’s Goliath in Virginia? The numbers suggest it’s possible.
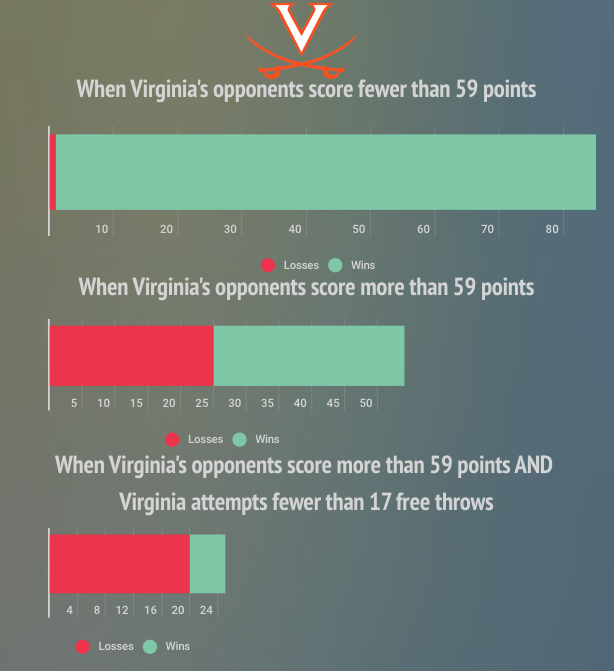
We used Virginia’s statistics from the prior 4 seasons to find, using JMP software, predictors for a Cavalier loss. We found that when UVA allows opponents to score at least 59 points, their win percentage drops to 53%. If opponents score at least 59 points AND Virginia attempts fewer than 17 free throws, that win percentage drops to just 20%; UMBC averaged 73 points per game during the 2018 regular season, and their opponents were averaging just 11 free throws per game. Furthermore, UVA’s team didn’t draw many fouls throughout the year; the team had the 6th least amount of free throw attempts in the NCAA in 2018, and the player who led the team in fouls drawn per 40 minutes, De’Andre Hunter, was out with a broken wrist (speaking of Hunter, his loss was incredibly significant; KenPom listed him as Virginia’s only Major Contributor, meaning he was the only player used on at least 24% of the team’s possessions). So going into the first-round matchup against the Retrievers, Virginia was not likely to shoot very many free throws.
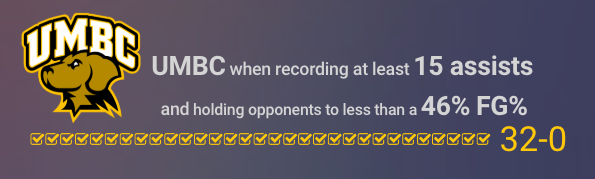
From 2015-2018, Virginia lost 70% of the time when their opponents shot at least 42% from the field and recorded more than 28 total rebounds. Sure enough, the Retrievers averaged a 44% field goal percentage and recorded an average of 35 total rebounds per game in 2018. 25 of UVA’s 26 losses in the previous 4 seasons came against teams with a turnover rate of less than 18.4%; UMBC’s 2018 average was 17.2%. All 26 of their losses came against teams with an adjusted defensive efficiency rating of less than 104. The Retrievers’ number? 102.6. It’s also worth noting that in the last 3 seasons, UMBC is 32-0 when they record at least 15 assists and hold opponents to a field goal percentage of less than 46%. 13 of those games occurred during the 2018 season, and the Retrievers won those games by an average margin of 15 points. Throughout the year, UMBC averaged just over 15 assists per game and their opponents averaged 44% from the field.
So given these stats which describe what teams do to beat the Cavaliers, what actually happened during the game? Well, UMBC put up 74 points, and Virginia shot only 8 free throws. Again, we said UVA wins only 20% of those games. UMBC shot 54.2% from the field and recorded 33 total rebounds; Virginia has lost 70% of those games the last 4 years. The Retrievers recorded 15 assists and held the Cavaliers to a 41% field goal percentage, and as mentioned, UMBC is undefeated the last 3 years in games where both of those boxes are checked.
It’s trivial whether these numbers mean UMBC was poised to beat Virginia. The numbers do show, however, that UVA generally lost to teams who in many ways were statistically similar to UMBC. Still, Virginia was the top seed in the tournament for a reason, and if they had played the way they had played all season, they should have had little problem with the Retrievers. UVA was undefeated in the past 4 seasons against teams with an adjusted offensive efficiency of less than 109.9, and UMBC’s number was 103.1. That difference in AdjOE was the difference between 81st and 206th in the NCAA last year. That less-than-impressive offense had to beat one of the best defenses in the country, and on that night, it’s likely the March Madness effect had some role in giving the Retrievers the hot hand that led them to the commanding and historic victory.